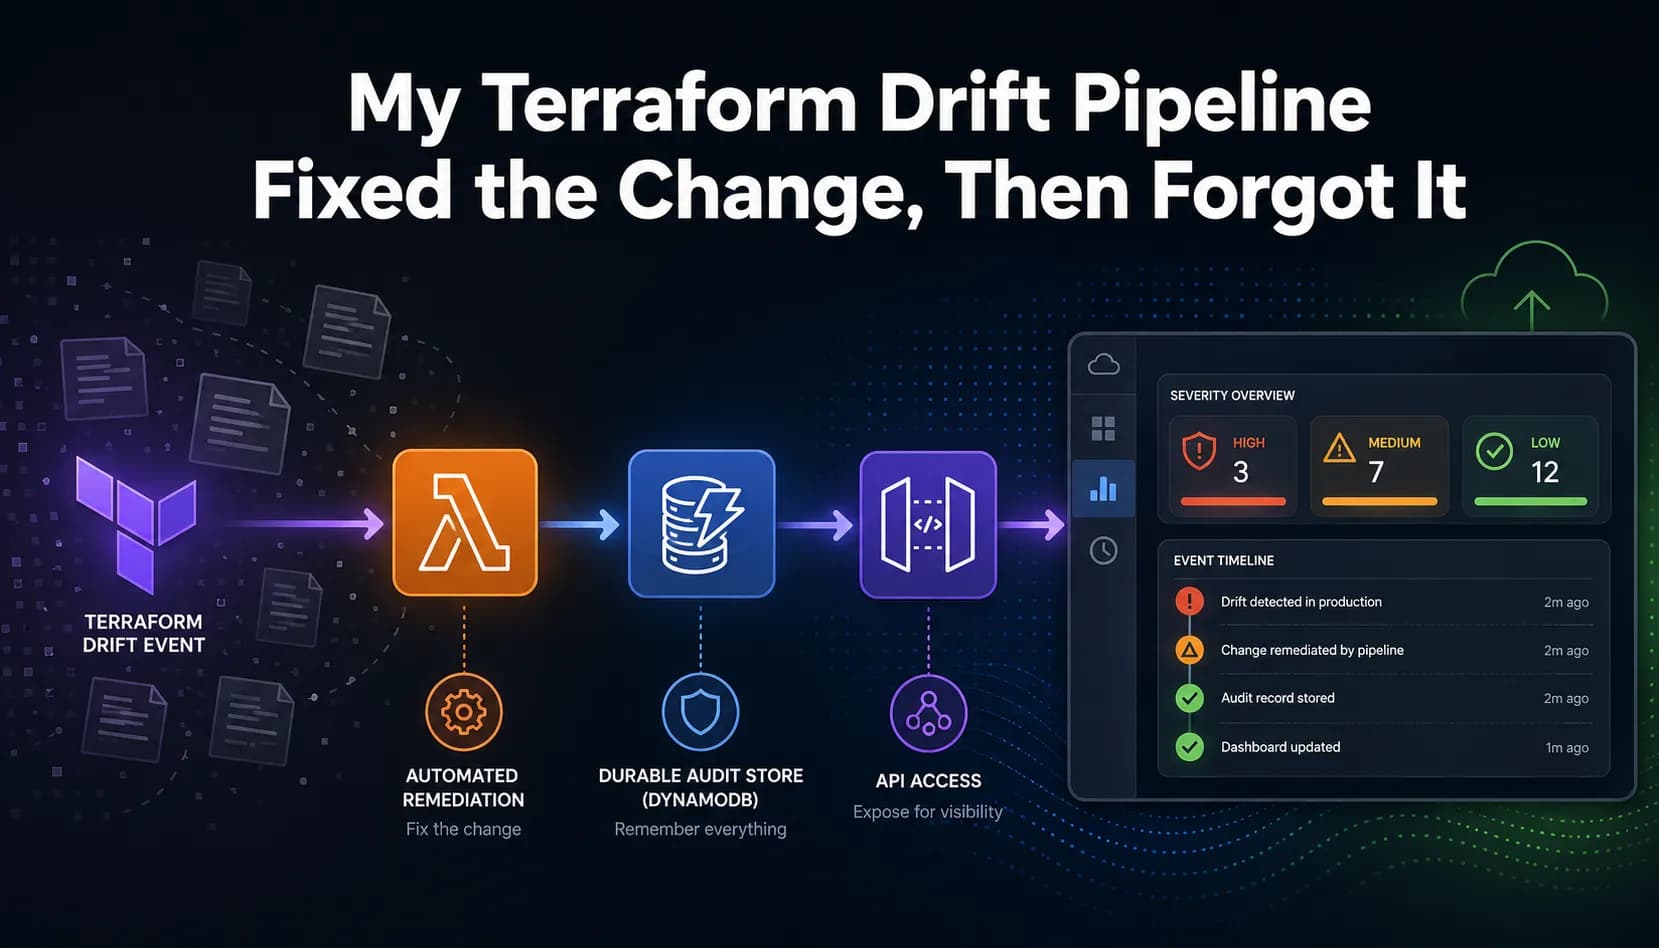
My Terraform drift pipeline could detect a manual EC2 tag change, classify it as LOW, and run Terraform to remove it.
Then the pipeline moved on.
The evidence existed, but it was spread across CodeBuild output, Lambda logs, and an SNS message. If I wanted to know what changed, how it was classified, and whether remediation started, I had to reconstruct the event from multiple AWS services.
The pipeline could act on drift. It could not remember drift.
Phase 4 added that memory: a durable DynamoDB record, a read only API, and a small dashboard that turns the event history into something I can inspect without opening three AWS consoles.
The Stack
Terraform drift event
        ↓
SNS
        ↓
Severity Lambda
        ├── classifies HIGH / MEDIUM / LOW
        ├── starts remediation for eligible LOW drift
        └── writes the audit event to DynamoDB
                            ↓
                    API Gateway HTTP API
                            ↓
                    Read only Lambda
                            ↓
                    DynamoDB Query
                            ↓
             CloudFront → static dashboard
                            ↑
                      private S3 bucket
The browser receives static HTML, CSS, and JavaScript from CloudFront. JavaScript calls API Gateway, the API Lambda queries DynamoDB, and the returned JSON becomes the live dashboard.
There is no EC2 web server and no application process running continuously.
Step 1: Store Every Classified Event
I created a DynamoDB table with a composite key:
resource "aws_dynamodb_table" "drift_events" {
  name         = "terraform-drift-events"
  billing_mode = "PAY_PER_REQUEST"
  hash_key     = "project"
  range_key    = "timestamp"

  attribute {
    name = "project"
    type = "S"
  }

  attribute {
    name = "timestamp"
    type = "S"
  }
}
project groups the history for one Terraform project. The ISO 8601 timestamp orders its events.
DynamoDB only requires attribute definitions for keys and indexes. Fields such as high_count, changes, and status still belong in each item, but they do not belong in the table schema block.
I passed the table name into the existing severity Lambda instead of putting it directly in the code:
environment {
  variables = {
    DRIFT_EVENTS_TABLE       = aws_dynamodb_table.drift_events.name
    REMEDIATION_PROJECT_NAME = aws_codebuild_project.remediation.name
  }
}
The same Lambda role received permission to write to that specific table:
{
  Effect = "Allow"
  Action = [
    "dynamodb:PutItem",
    "dynamodb:UpdateItem",
    "dynamodb:GetItem",
    "dynamodb:Query",
    "dynamodb:Scan",
  ]
  Resource = aws_dynamodb_table.drift_events.arn
}
After classification, Lambda builds one audit item:
item = {
    "project": project,
    "timestamp": timestamp,
    "drift_count": len(changes),
    "high_count": len(classified["HIGH"]),
    "medium_count": len(classified["MEDIUM"]),
    "low_count": len(classified["LOW"]),
    "changes": classified,
    "action_taken": action_taken,
    "status": status,
}

if remediation_build_id:
    item["remediation_build_id"] = remediation_build_id

drift_table.put_item(Item=item)
The record stores the decision alongside the evidence used to make it. I do not need to correlate an SNS payload with a separate classification log just to understand one event.
For a change that needs human review, the item records manual_review. When Lambda starts the remediation build, it records remediation_triggered and includes the CodeBuild build ID.
That turns the audit item into the connection between detection, classification, and the action taken by the pipeline.
Step 2: Add a Read Only History API
The dashboard should not receive DynamoDB credentials. It calls an HTTP API instead.
I created a second Lambda whose only data permission is:
Action   = ["dynamodb:Query"]
Resource = aws_dynamodb_table.drift_events.arn
The route requires a project:
GET /drift-history?project=Three-Tier-Infra
The Lambda queries the partition key and returns newest events first:
response = table.query(
    KeyConditionExpression="#project = :project",
    ExpressionAttributeNames={"#project": "project"},
    ExpressionAttributeValues={":project": project},
    ScanIndexForward=False,
)
This is why the table uses project as its partition key. The API does not need to scan the complete table to retrieve one project's history.
DynamoDB numbers arrive in Python as Decimal, which json.dumps cannot serialize directly. I added a small serializer:
def json_serializer(value):
    if isinstance(value, Decimal):
        return int(value) if value % 1 == 0 else float(value)
    raise TypeError(f"Cannot serialize {type(value)}")
API Gateway uses an HTTP API with a Lambda proxy integration:
resource "aws_apigatewayv2_route" "get_drift_events" {
  api_id    = aws_apigatewayv2_api.drift_api.id
  route_key = "GET /drift-history"
  target    = "integrations/${aws_apigatewayv2_integration.drift_api.id}"
}
Calling the deployed route returned HTTP 200 and the stored event:
curl \
  "https://8zg1x51wne.execute-api.us-east-2.amazonaws.com/drift-history?project=Three-Tier-Infra"
The response contained:
{
  "events": [
    {
      "project": "Three-Tier-Infra",
      "timestamp": "2026-07-26T15:29:32Z",
      "drift_count": 1,
      "high_count": 0,
      "medium_count": 0,
      "low_count": 1,
      "action_taken": "remediation_triggered",
      "status": "REMEDIATION_STARTED"
    }
  ]
}
The changed resource was:
module.compute.aws_instance.bastion_host
Terraform reported it as an aws_instance update.
Step 3: Build a Dashboard Without a Web Server
The dashboard is static in how it is hosted, not in the data it displays.
S3 stores three files:
dashboard/
├── index.html
├── app.js
└── styles.css
CloudFront serves those files over HTTPS. app.js calls the API whenever the page loads or the user refreshes the data.
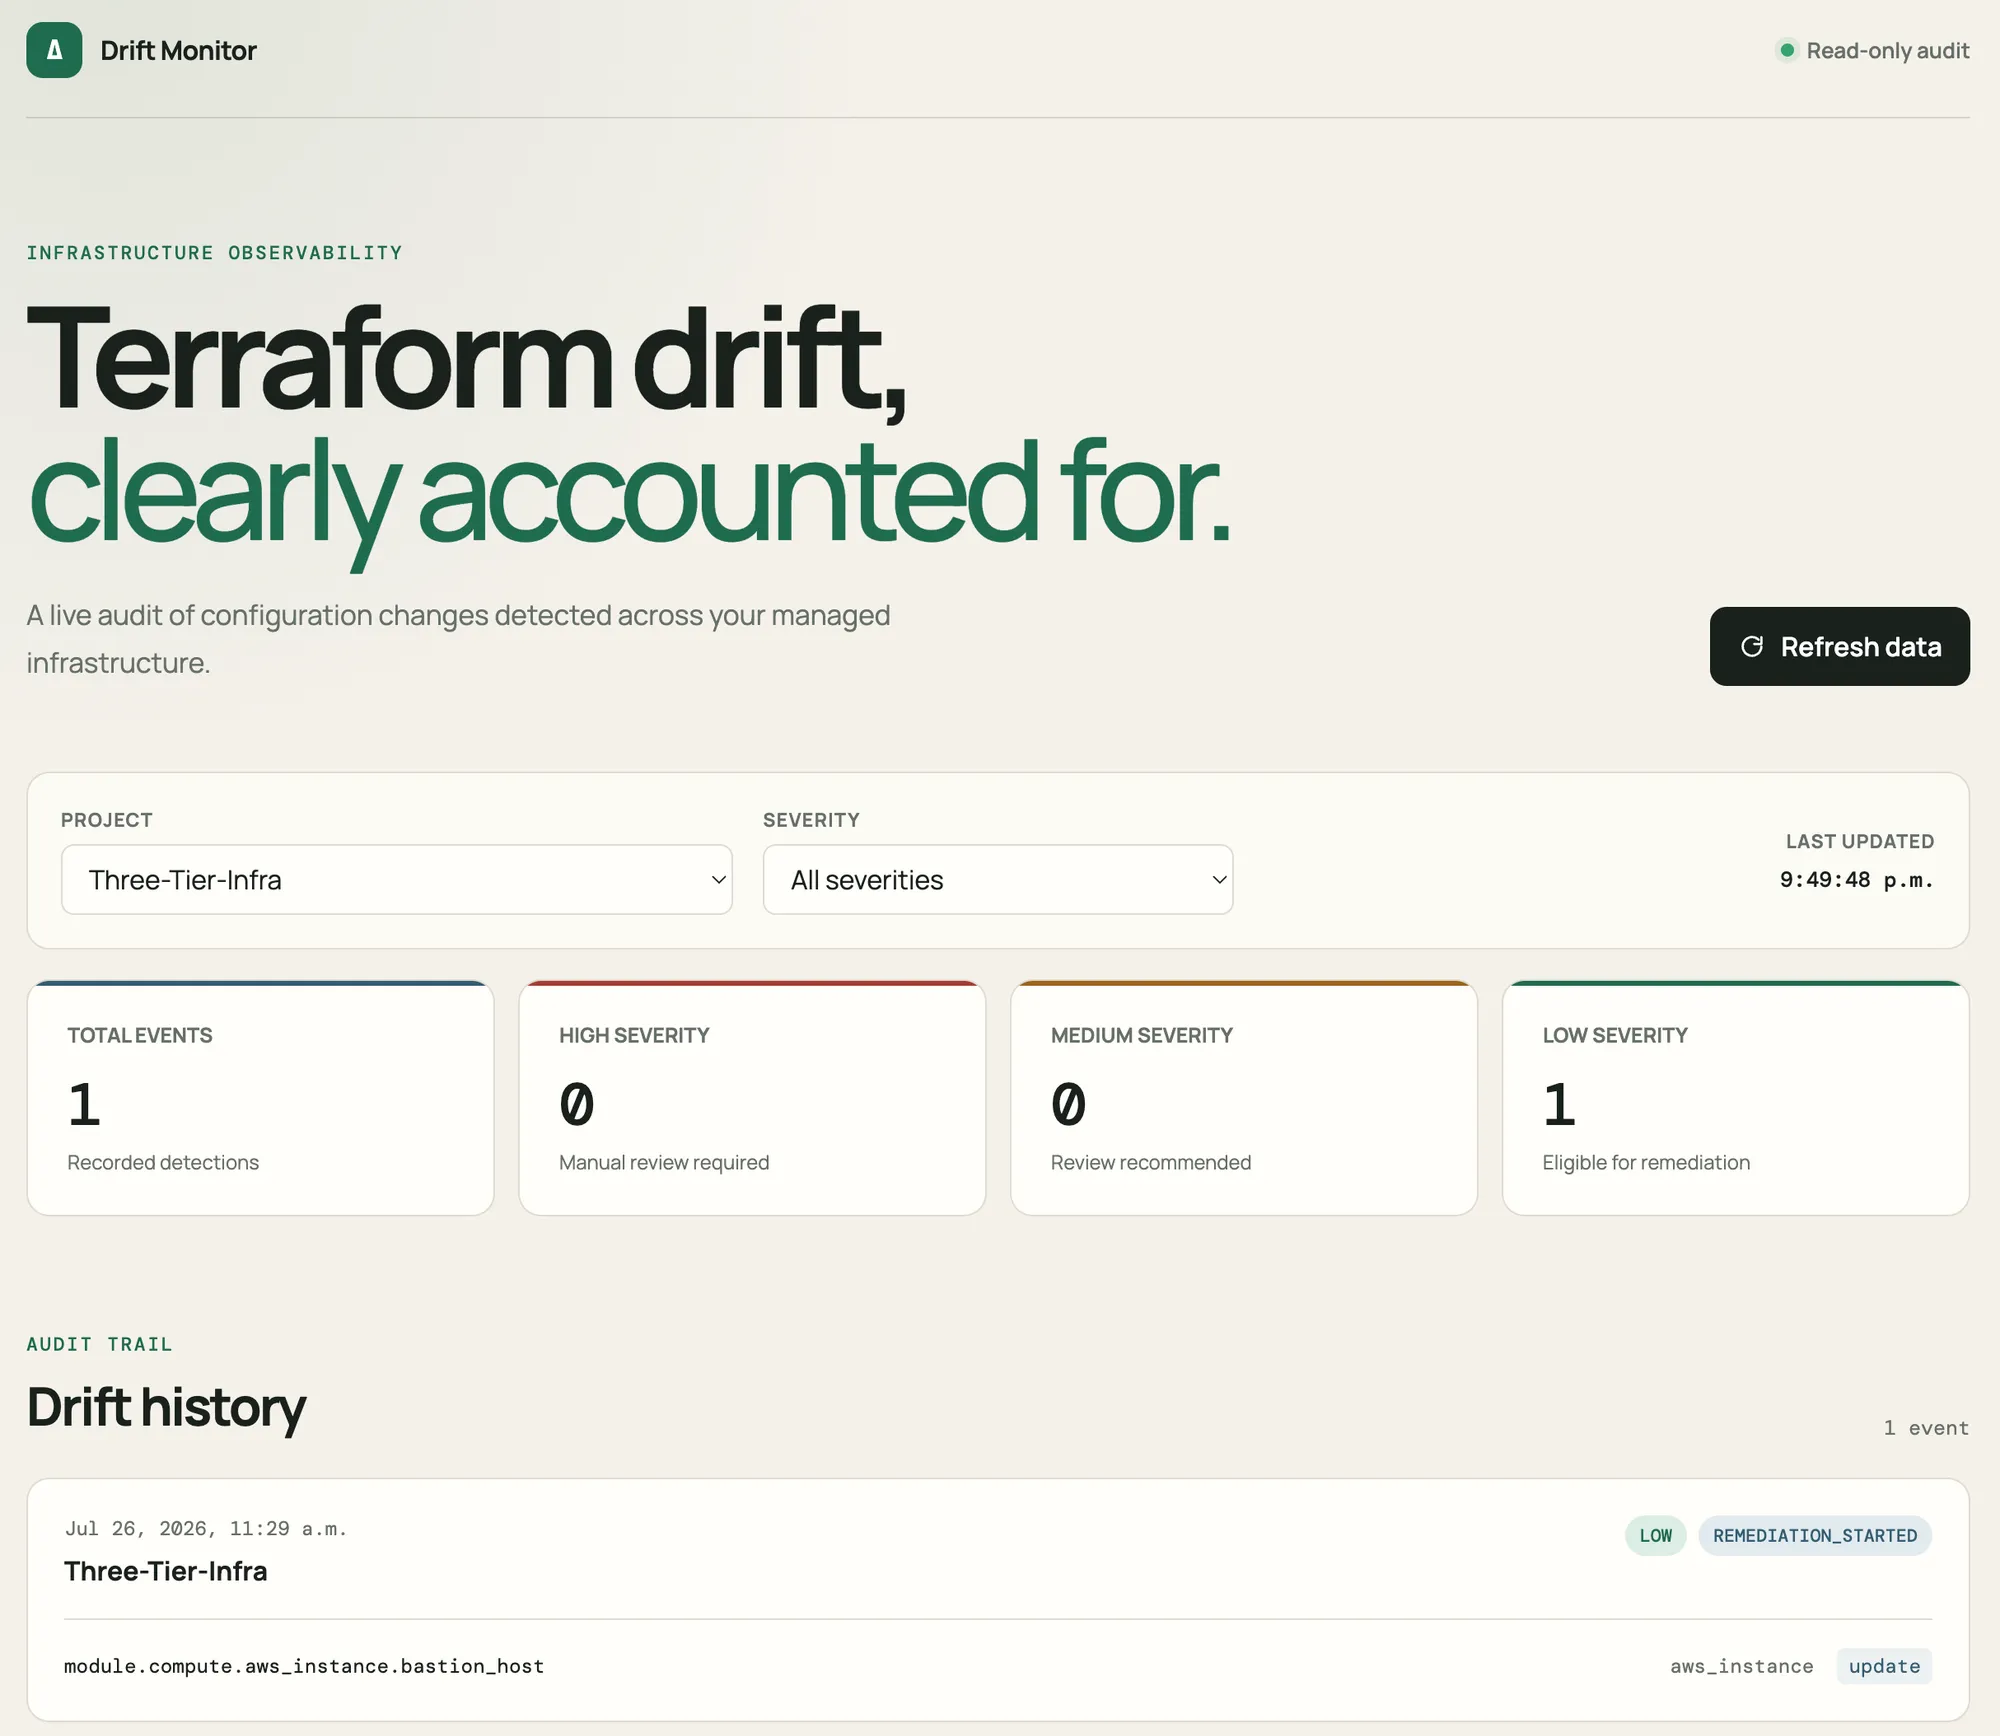
The dashboard shows total events, severity counts, detection timestamps, Terraform resource addresses, actions, and remediation status. A severity filter narrows the history, and the page refreshes automatically every 60 seconds.
The S3 bucket remains private. CloudFront uses Origin Access Control to read objects:
resource "aws_cloudfront_origin_access_control" "drift_dashboard" {
  name                              = "terraform-drift-dashboard"
  origin_access_control_origin_type = "s3"
  signing_behavior                  = "always"
  signing_protocol                  = "sigv4"
}
The bucket policy grants s3:GetObject to the CloudFront service only when the request comes from this distribution.
Step 4: Keep the Public Surface Read Only
I deliberately did not add a Fix drift button.
The first dashboard is for visibility. It cannot start CodeBuild, run Terraform, or change DynamoDB records.
The API exposes one GET route. I added API Gateway throttling:
default_route_settings {
  throttling_burst_limit = 20
  throttling_rate_limit  = 10
}
I also restricted browser CORS responses to the deployed CloudFront origin:
cors_configuration {
  allow_headers = ["content-type"]
  allow_methods = ["GET"]
  allow_origins = [
    "https://${aws_cloudfront_distribution.drift_dashboard.domain_name}"
  ]
  max_age = 3600
}
CORS is not authentication. Someone who knows the API URL can still call it outside a browser.
That is an accepted limitation for this public dashboard. The API returns resource addresses, classifications, and actions. It does not return raw Terraform state, credentials, plan values, or CloudWatch logs.
An operator remediation API would require authentication, authorization, review, concurrency controls, and an audit record of who approved the action. It does not belong in this first dashboard.
Verification
I created real drift by changing the tag on:
module.compute.aws_instance.bastion_host
The detection pipeline reported one LOW update. Lambda started remediation and wrote this event to DynamoDB:
project:              Three-Tier-Infra
drift_count:          1
high_count:           0
medium_count:         0
low_count:            1
action_taken:         remediation_triggered
status:               REMEDIATION_STARTED
The record also contained the remediation CodeBuild ID and the classified resource details.
After remediation, I returned to the EC2 instance and confirmed the tag was restored to the value declared in Terraform.
I then tested the deployed layers independently:
CloudFront index.html: HTTP 200
CloudFront app.js:     HTTP 200
API history query:     HTTP 200
CORS origin:           CloudFront dashboard URL
The API response to the dashboard origin included:
access-control-allow-origin: https://dqjunwd8v0pry.cloudfront.net
The complete verified path was:
EC2 tag changed
→ Terraform detected one update
→ Lambda classified it LOW
→ Lambda wrote the event to DynamoDB
→ remediation restored the tag
→ API returned the audit event
→ dashboard displayed the history
The DynamoDB status remains REMEDIATION_STARTED. That proves CodeBuild accepted the build request, not that the build ultimately succeeded. I verified success separately by observing the restored EC2 tag.
Updating the audit item from REMEDIATION_STARTED to REMEDIATION_SUCCEEDED is separate completion tracking work.
What Comes Next
The system can now detect drift, classify it, remediate the tested LOW tag scenario, remember the event, expose it through an API, and display it in a dashboard.
The next step is making the audit lifecycle more complete. The current item proves that CodeBuild accepted the remediation request, but it does not record the final build result.
Tracking that result would let the same event move from REMEDIATION_STARTED to REMEDIATION_SUCCEEDED or REMEDIATION_FAILED.