I Traced One Agent Question. The Trace Found Two Things I Forgot to Turn Off.
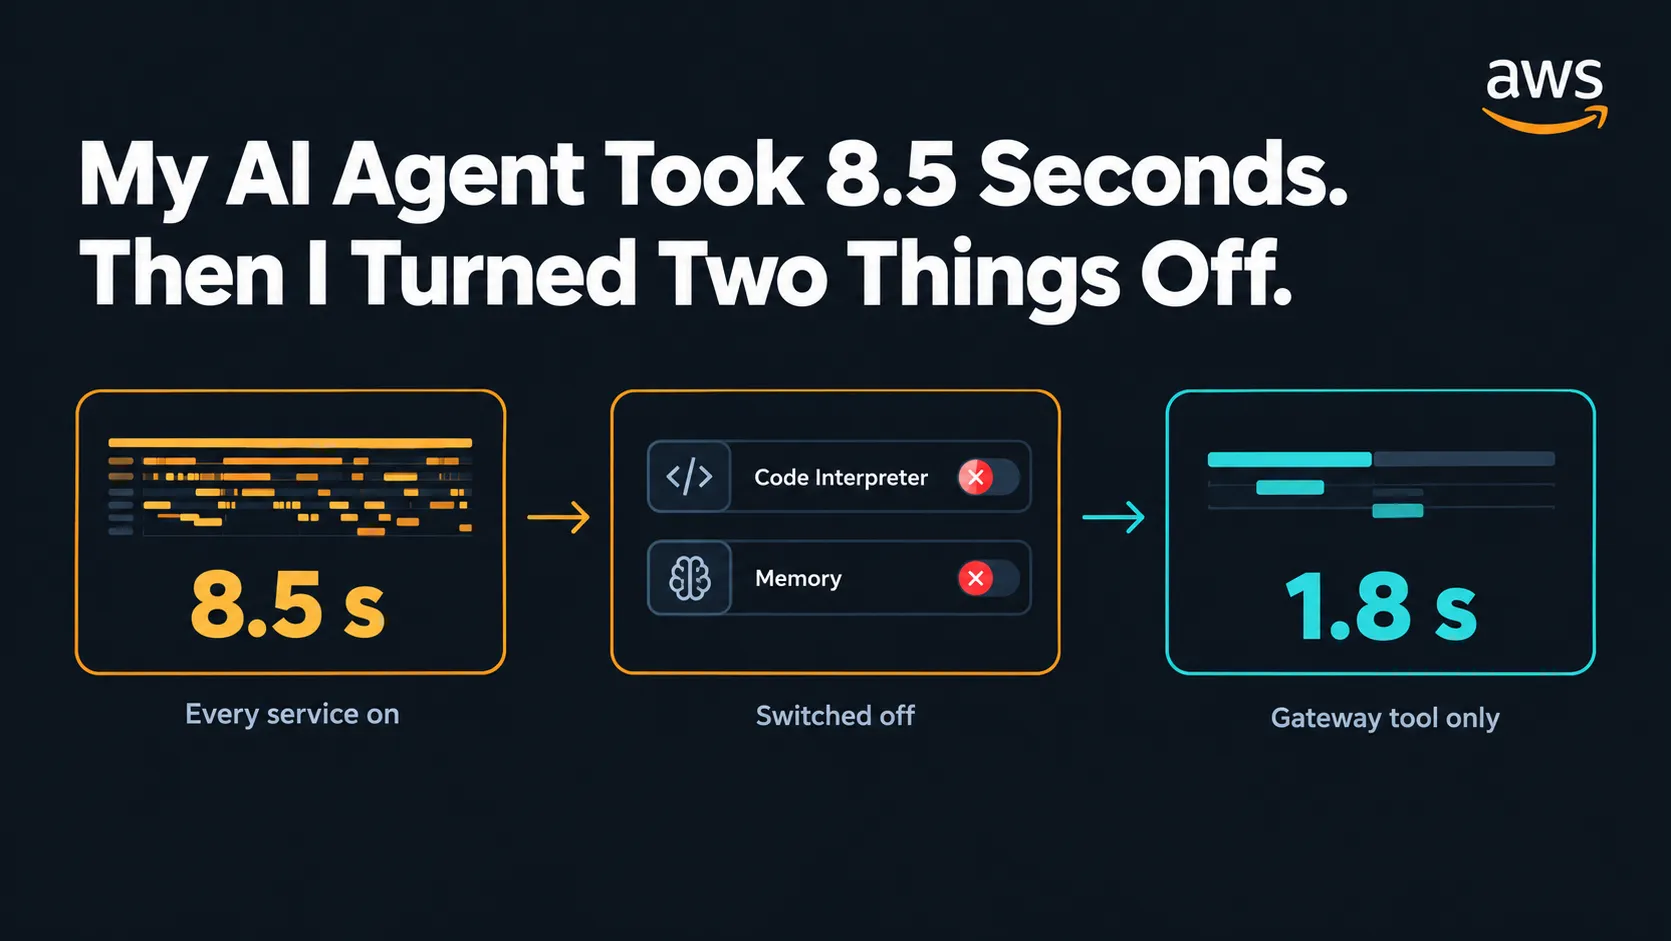
I traced the same agent question twice. With Code Interpreter and memory on, it took 8.5 seconds. With only the Gateway tool left, it took 1.8.
Browse 19 articles by topic or keyword.

I traced the same agent question twice. With Code Interpreter and memory on, it took 8.5 seconds. With only the Gateway tool left, it took 1.8.

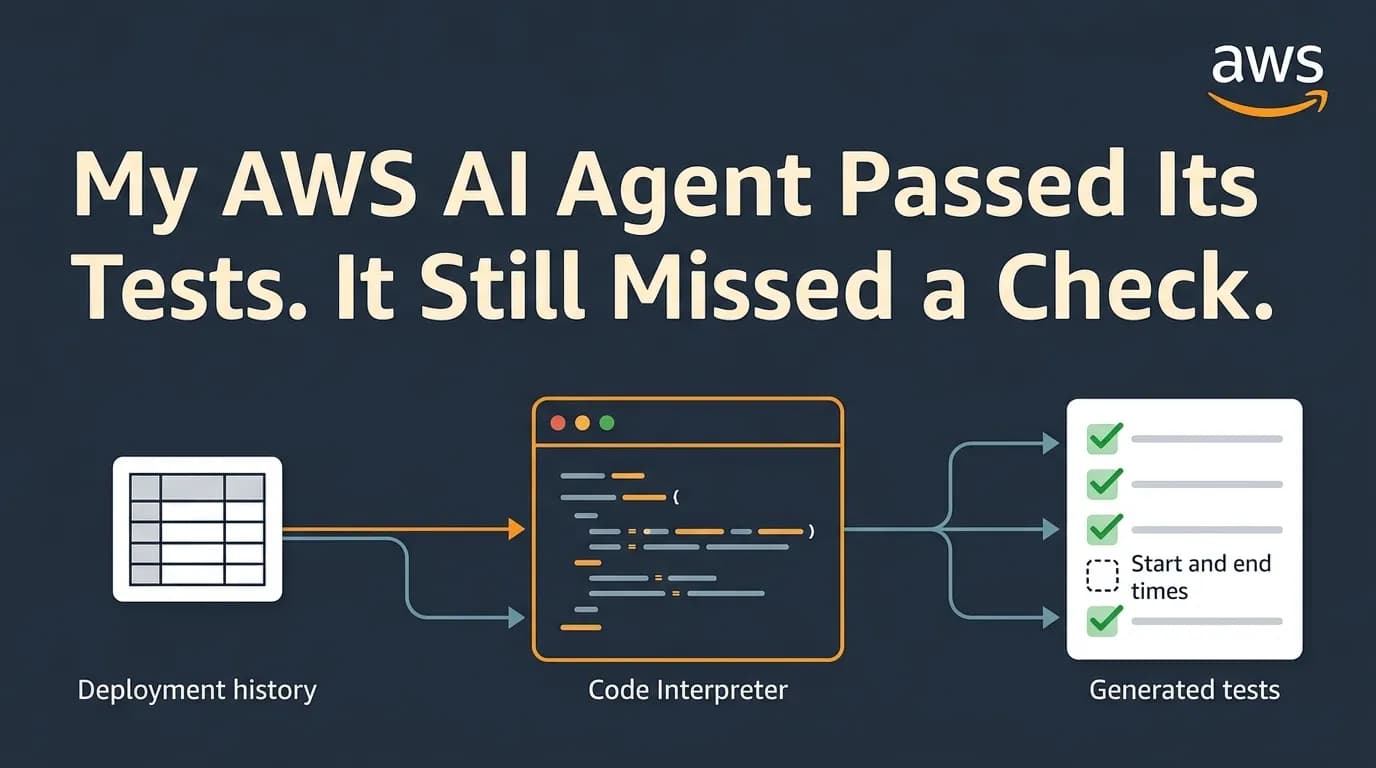
In my personal AWS lab, an agent generated Python and correctly analyzed a synthetic deployment history. Its tests passed, but they did not check every expected start and end timestamp. I compared the output with independent calculations and inspected the assertions to see what the result actually proved.

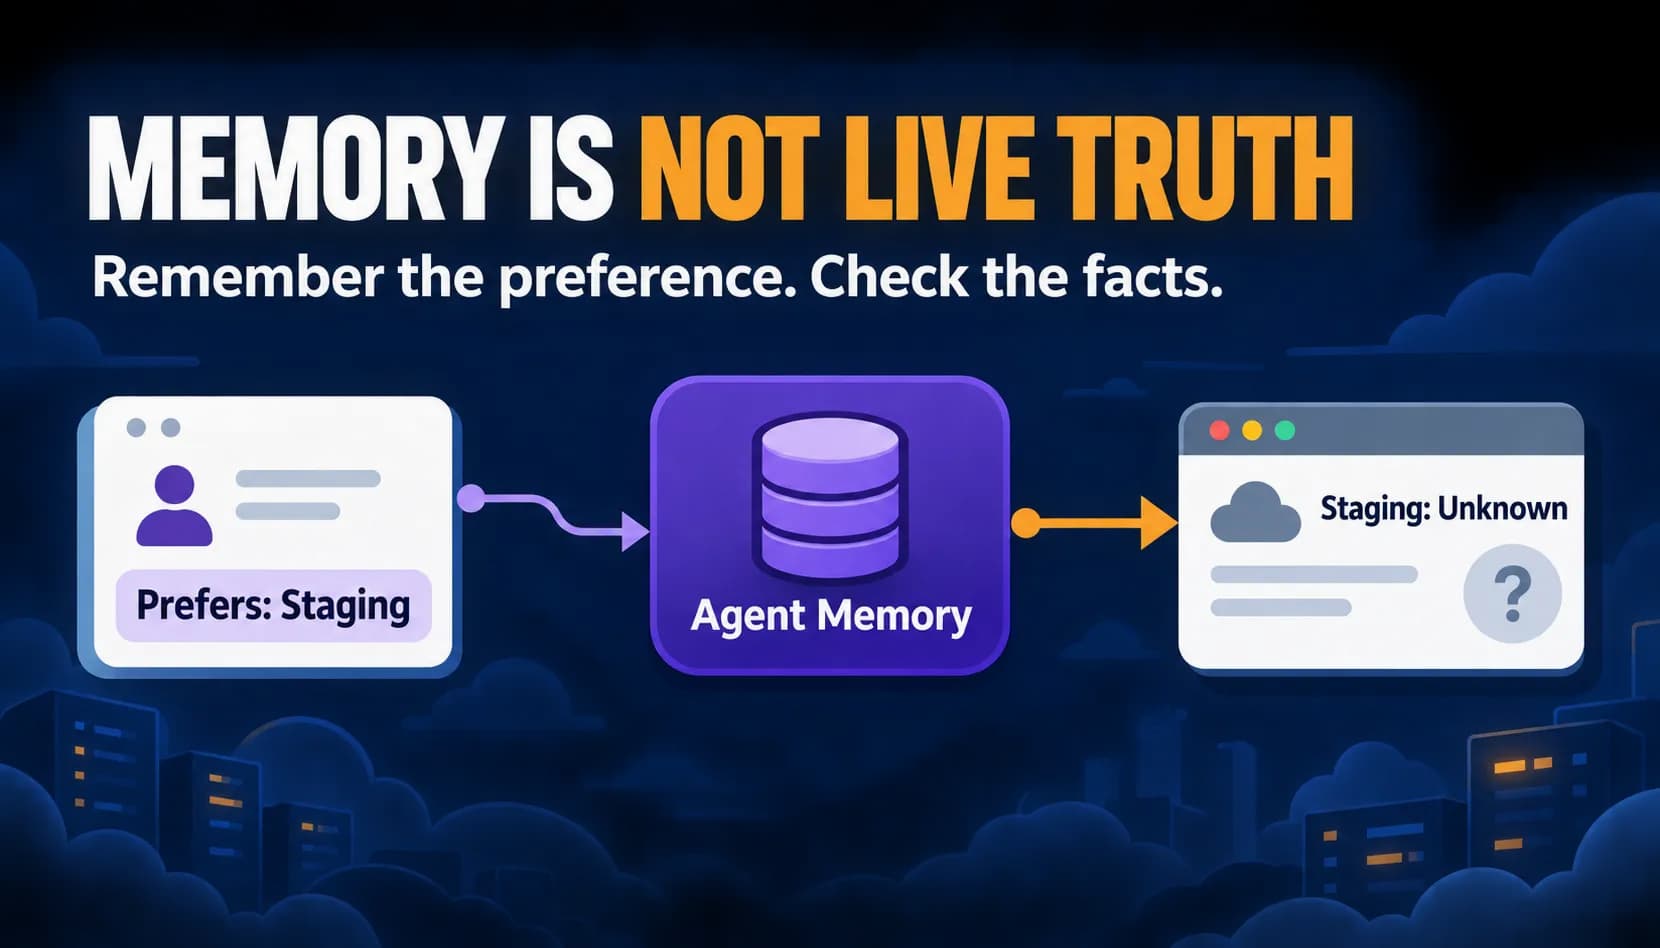
My CloudOps agent remembered which environment I preferred. Then I changed that preference to an environment its deployment tool did not support. The result clarified a useful boundary: memory can preserve context, but current facts still need a current source.

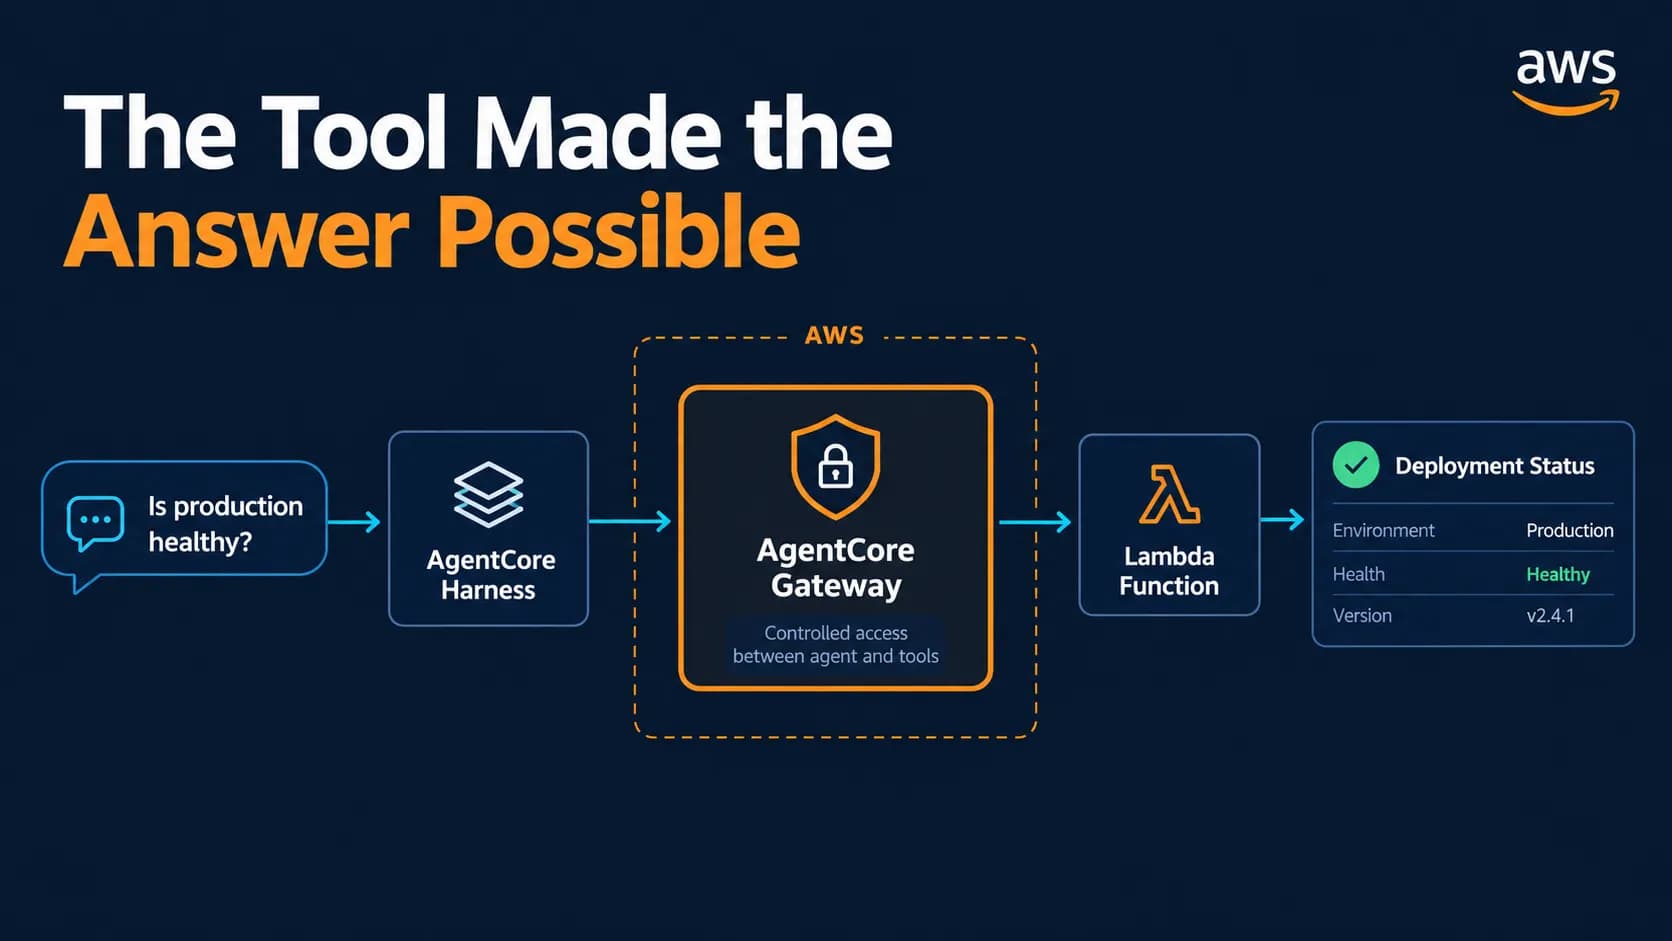
My first CloudOps agent refused to say whether production was healthy because it had no operational data. I added a deterministic Lambda through Amazon Bedrock AgentCore Gateway, tested the complete tool path, fixed a protocol mistake, and learned why a grounded answer is only as reliable as its underlying source.

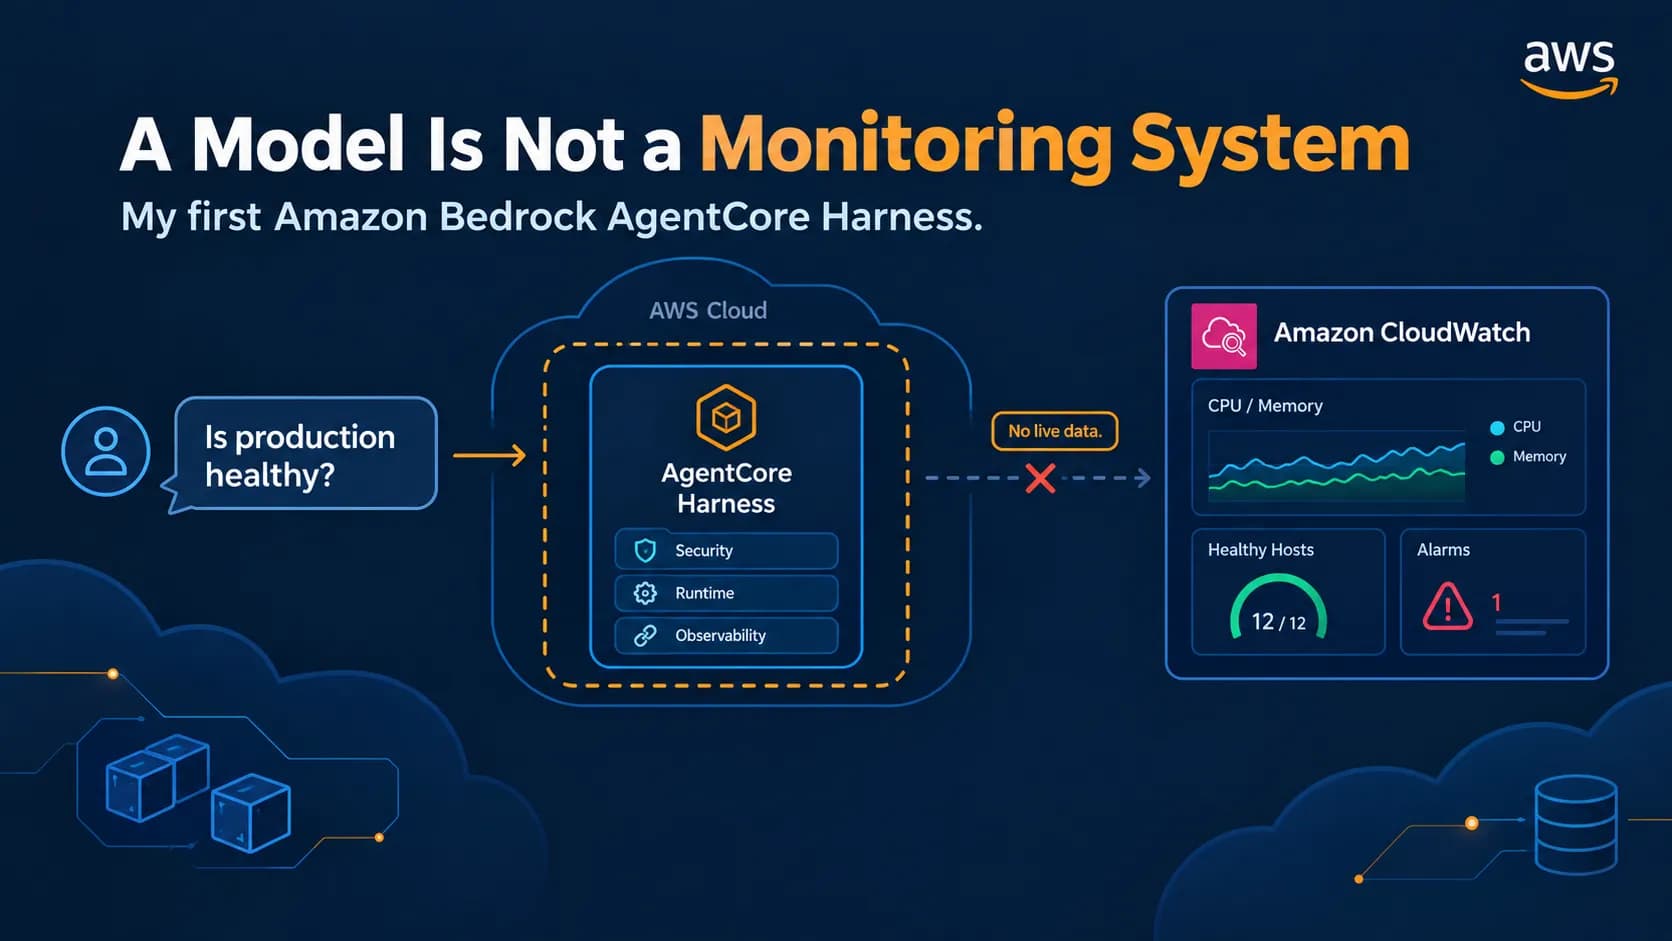
I deployed a managed AgentCore Harness and asked whether production was healthy. Its refusal was the correct result for this experiment: the agent had a model and a prompt, but no authoritative operational data. The deployment and trace made that boundary concrete.

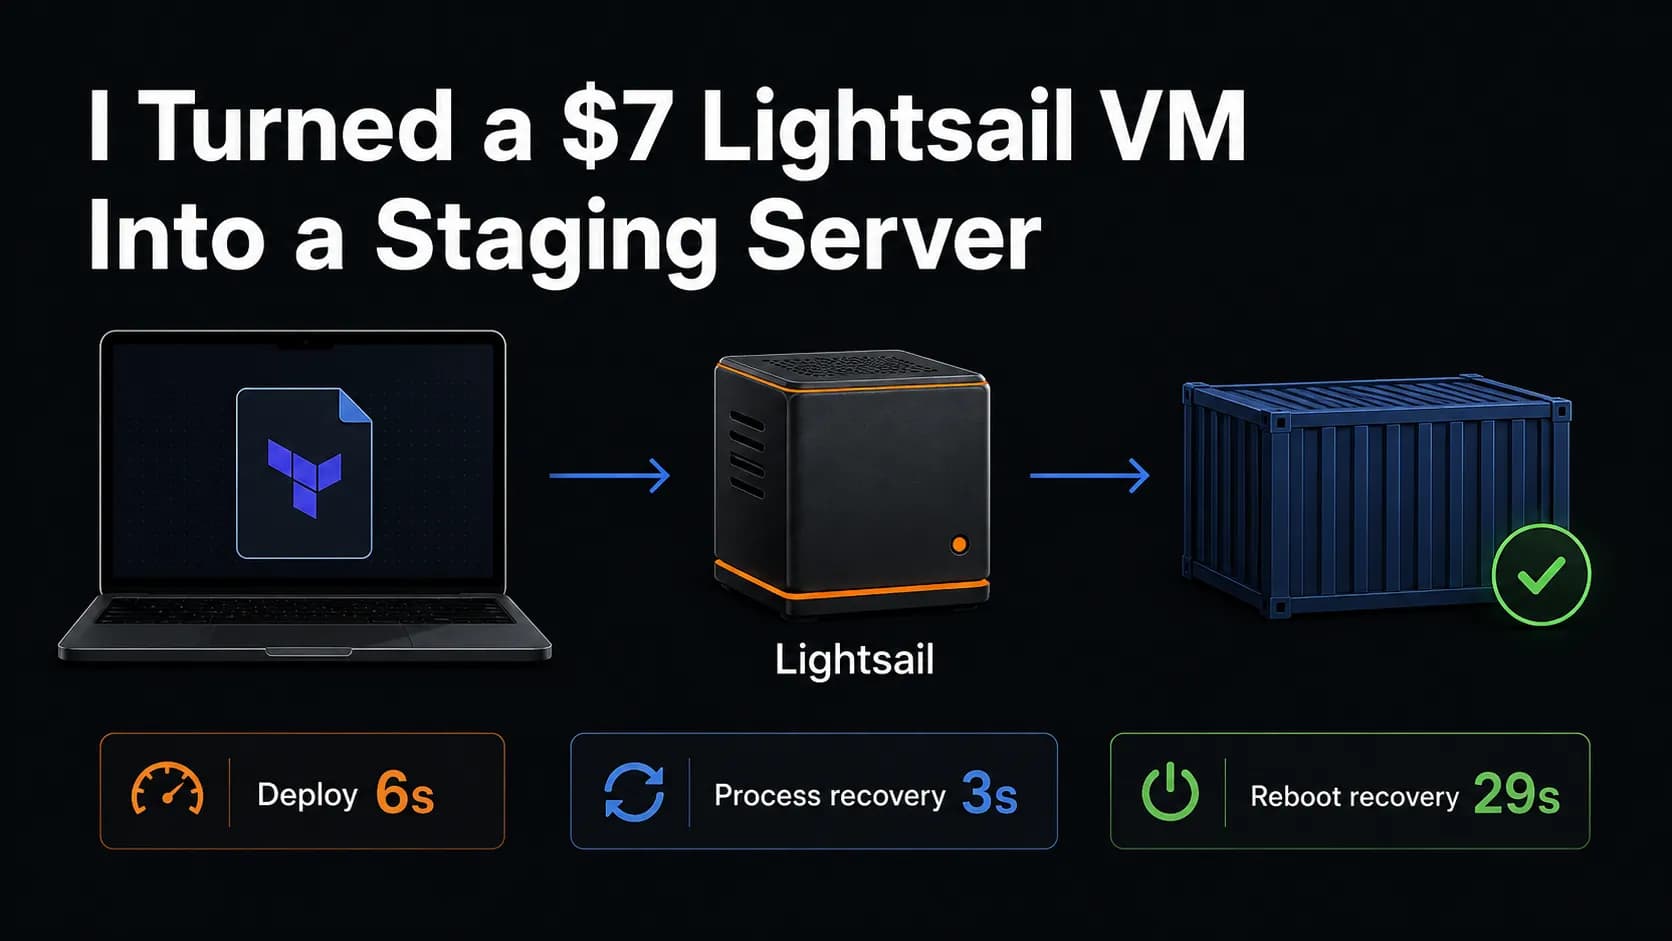
I wanted a staging server that was more realistic than local Docker but smaller than a full AWS platform. I used Terraform and Docker Compose to build one on a $7 Lightsail plan, then measured deployment, application recovery, instance reboot recovery, cost, and cleanup.

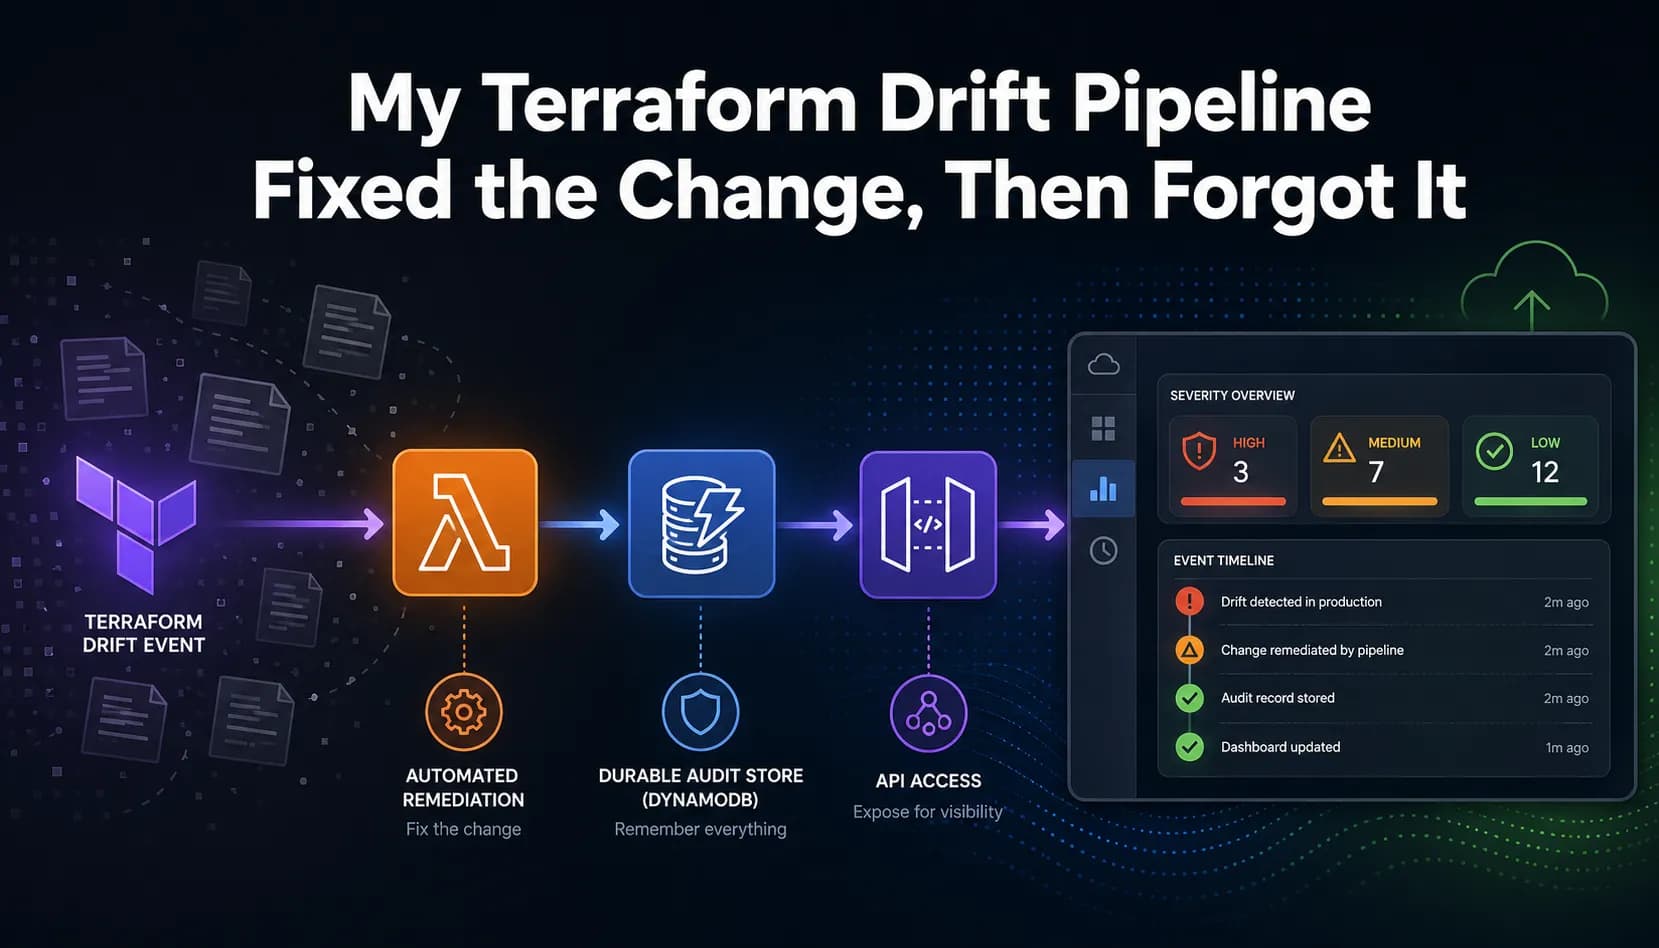
My Terraform drift pipeline could detect an EC2 tag change and remove it automatically, but the evidence was scattered across temporary logs. I added a DynamoDB audit trail, a read only Lambda API, and a CloudFront dashboard so the system could remember and display every classified drift event.

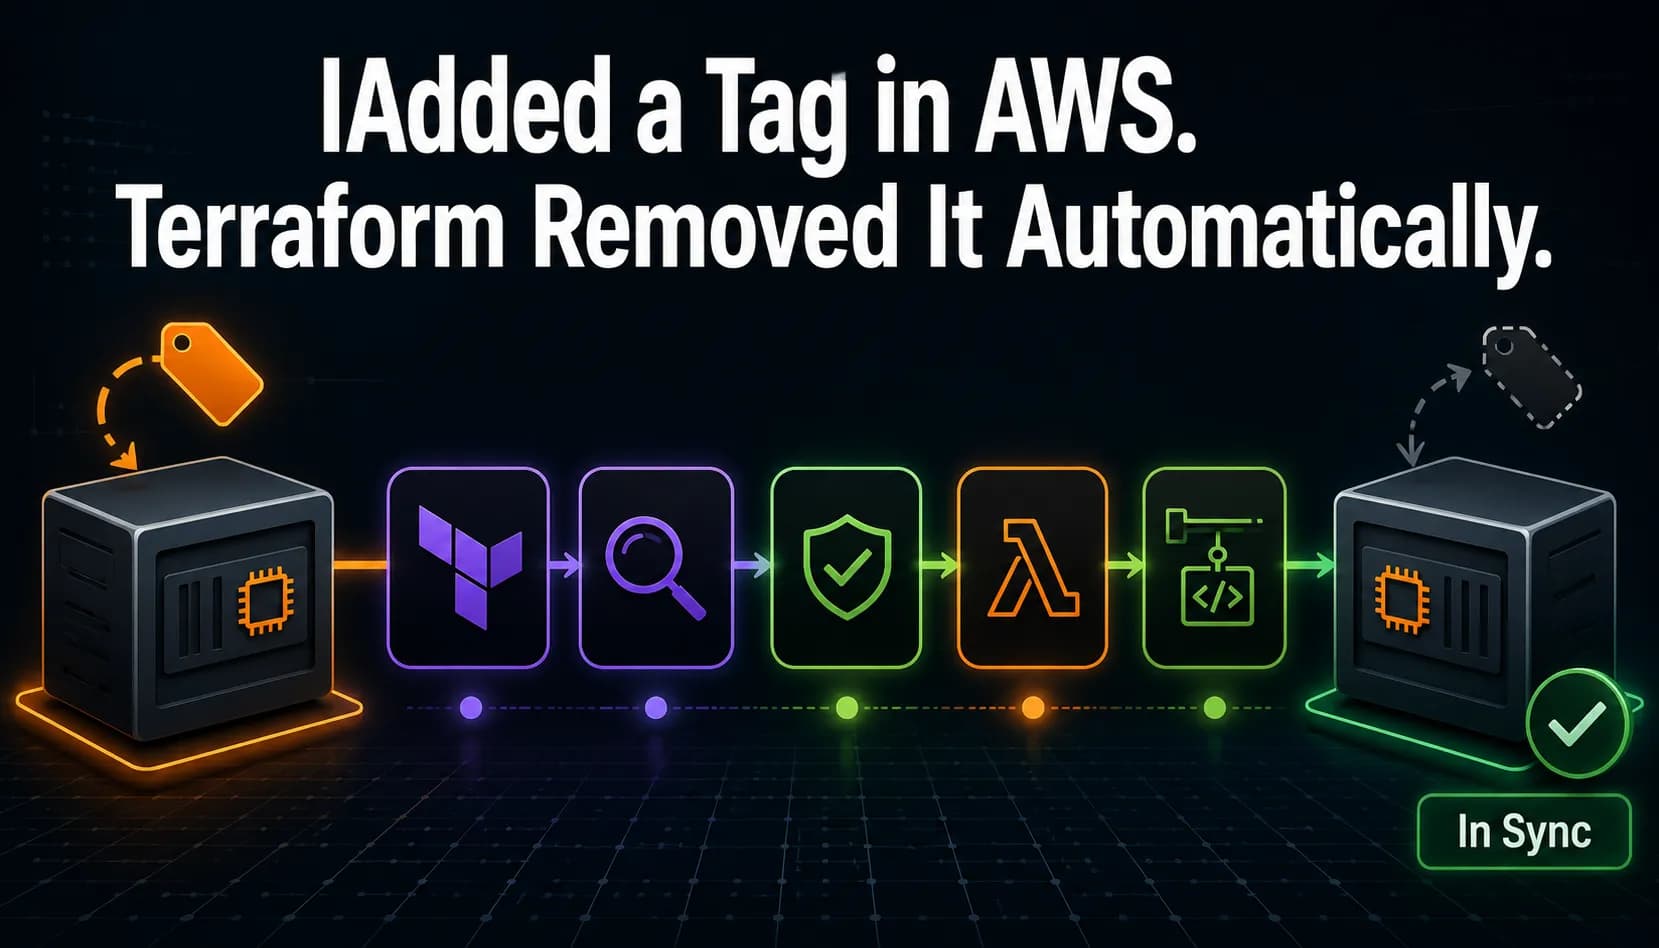
I added a tag directly to an EC2 instance in AWS, then ran my Terraform drift detector. The change was classified as LOW, Lambda started a separate remediation build, and Terraform removed the tag automatically.

My Terraform drift detector could send an email, but it could not explain what changed or how serious it was. I changed the SNS message into structured JSON, delivered it to SQS for audit processing, and used Lambda to classify every resource change by severity.

Terraform could reproduce my infrastructure, but it could not warn me when someone changed AWS manually. I built a CodeBuild job that runs Terraform plan, handles the drift exit code correctly, reads shared configuration from SSM, and sends an SNS email when the real infrastructure no longer matches the code.

How to add Prometheus and Grafana to an ECS Fargate app, run load tests, and prove self-healing with a deliberate crash. Built on EC2 with Docker Compose.

How to expose an ECS Fargate app publicly using an Application Load Balancer, target groups, and Terraform. Includes subnet AZ requirements and security group locking.